
Zcash has become one of the more talked about coins in crypto this week. The token has posted a sharp rally, and it now has fresh attention from a new U.S. exchange traded product.
This Zcash price prediction looks at the chart pattern behind the move, along with the news driving interest in the privacy focused coin.
What Happened With Zcash Recently?
Grayscale launched its Zcash ETF, called ZCSH, on August 25. The fund began trading on NYSE Arca that day.
The product was converted from the existing Grayscale Zcash Trust. It is the first U.S. exchange traded product built specifically around ZEC.
As of August 24, the fund held about $314 million in assets and roughly 387,200 ZEC. It carries a 2.5 percent management fee, and Grayscale said fee revenue from the first year will go toward supporting the Zcash ecosystem and marketing.
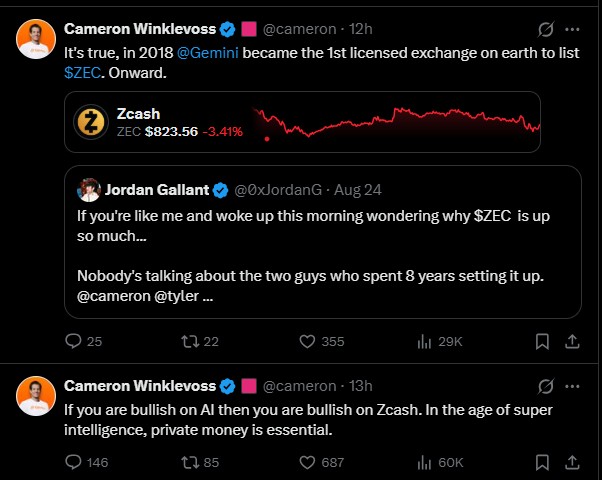
The listing adds to a growing list of milestones for the coin. Gemini was the first licensed exchange to list ZEC back in 2018.
Why Is Zcash Getting So Much Attention?
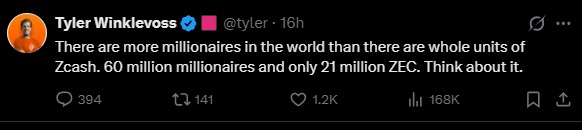
Interest in Zcash has also been fueled by social media commentary from well known figures in crypto. Tyler Winklevoss recently pointed out that there are more millionaires worldwide than there are total units of Zcash, noting there are about 60 million millionaires against a fixed cap of 21 million ZEC.
His brother Cameron Winklevoss added that privacy focused money could become more important as artificial intelligence becomes more widespread, linking bullish views on AI to bullish views on Zcash.
These are opinions from public figures, not confirmed facts about future price movement. They reflect growing sentiment around the coin rather than guaranteed outcomes.
What Is the Current Zcash Price Trend?
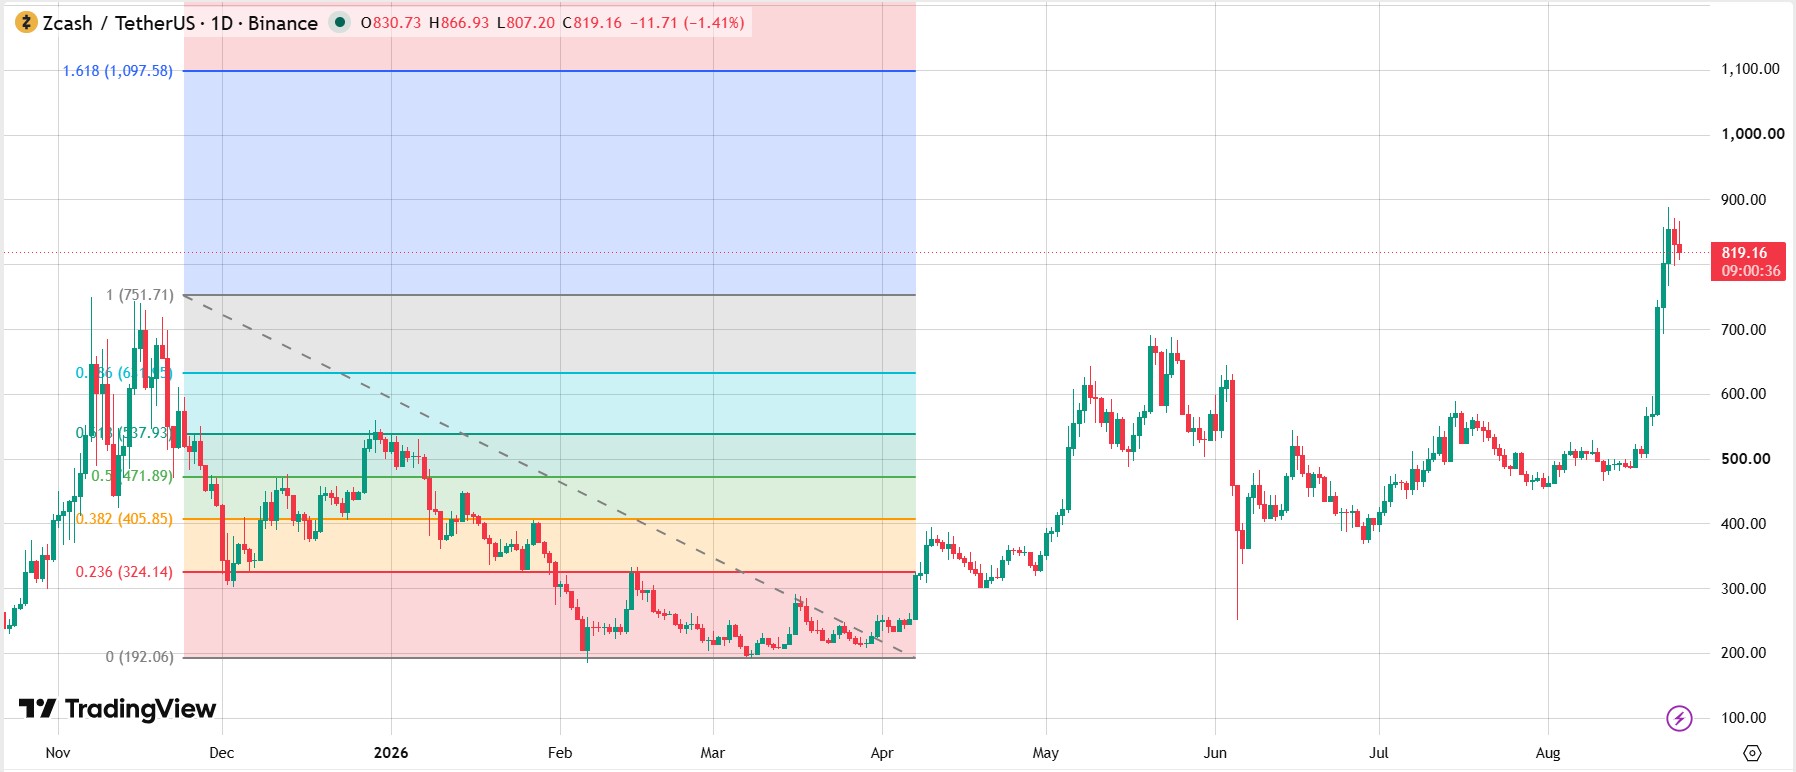
On the daily chart, ZEC spent several months consolidating in a range between roughly $450 and $550. That sideways period ended with a strong breakout.
The price pushed above the $751.71 Fibonacci level, a move that marked a real shift in momentum. ZEC is now trading near $819, after touching an intraday high close to $867.
This kind of move, a long consolidation followed by a sharp breakout, often signals that buyers have taken clear control of the short term trend.
What Are the Key Support Levels for Zcash?
The $751 area is now the most important level to watch on the downside. This was previously resistance, and it flipped into support after the breakout.
If ZEC loses that level, the chart suggests a pullback toward the $638 to $640 zone could follow. Below that, the $538 region is the next area buyers may look to defend.
Can Zcash Break the Key Resistance Level?
The immediate hurdle sits in the $866 to $870 zone, which lines up with the recent intraday high. A confirmed close above this zone would suggest continuation rather than a temporary spike.
|
Level/Indicator |
Current Reading |
What It Means |
|
Price |
~$819 |
Trading above the $751.71 breakout level |
|
Resistance |
$866–$870 |
Zone that capped the recent intraday high |
|
Support |
$751 |
Former resistance, now the key level to hold |
|
Secondary Support |
$638–$640 |
Next area to watch if $751 fails |
|
Deeper Support |
$538 |
Level tied to the prior consolidation range |
|
Fibonacci Extension |
$1,097 |
1.618 extension target if resistance breaks |
What Could Drive the Next Zcash Price Move?
A clean break above $866 to $870 would open the path toward the 1.618 Fibonacci extension near $1,097. A sustained move past that level could lead to further price discovery, meaning the coin would be trading in territory with little recent price history to reference.
On the other hand, losing the $751 support would shift the near term picture, pointing toward the $638 to $640 area as the next zone to watch.
Is Zcash Price Turning Bullish or Bearish?
The overall chart structure leans bullish as long as ZEC holds above $751. That said, the size and speed of the recent rally raises the chance of short term profit taking, which could bring extra volatility even inside a broader uptrend.
Zcash Price Prediction: Bullish, Neutral, and Bearish Scenarios
In a bullish scenario, ZEC clears the $866 to $870 resistance zone and works toward the $1,097 extension target over time.
In a neutral scenario, price could chop between the $751 support and the $866 to $870 resistance while the market digests recent gains.
In a bearish scenario, a break below $751 could send ZEC down to test $638 to $640, and possibly the $538 zone if selling pressure builds.
Important Levels Traders Should Watch
Traders following ZEC should keep an eye on the $751 support, the $866 to $870 resistance band, and the $1,097 extension target on the upside. A daily close outside the $751 to $870 range would likely set the tone for the next leg.
Conclusion
Zcash has moved from a long consolidation into a clear uptrend, helped by both technical momentum and fresh headlines around its new U.S. ETF listing. Whether the rally extends toward $1,097 or cools off near current resistance will likely depend on how price behaves around the $751 support and the $866 to $870 resistance zone in the coming sessions. The market outlook remains open, and traders should watch these levels closely rather than assume a specific outcome.
Financial Risk Disclaimer
This article is for informational purposes only and does not constitute financial advice. Cryptocurrency markets are highly volatile and carry significant risk, including the risk of loss. Readers should conduct their own research and consult a licensed financial advisor before making investment decisions.